Breakouts With DXY Filter Strategy [LuciTech]This advanced breakout strategy combines pivot-based breakout detection with an innovative DXY (US Dollar Index) inverse correlation filter to enhance trade selection quality. The strategy identifies breakouts from recent pivot highs and lows while using DXY movements as a confirmation filter, based on the principle that USD strength/weakness often inversely correlates with other asset movements.
Key Features
Core Breakout Logic
- Pivot-Based Detection: Identifies breakouts above recent pivot highs (bullish) and below recent pivot lows (bearish)
- Customizable Lookback: Adjustable pivot length for different market conditions
- Visual Breakout Lines: Optional display of breakout levels with customizable colors
DXY Inverse Correlation Filter
- Smart USD Filter: Uses DXY movements to confirm breakout signals
- Inverse Logic: Long signals require DXY bearishness, short signals require DXY bullishness
- Threshold Control: Minimum DXY movement percentage required for signal confirmation
- Real-time DXY Data: Pulls live DXY data for accurate correlation analysis
Moving Average Filter
- Multiple MA Types: Support for SMA, EMA, WMA, VWMA, and HMA
- Trend Confirmation: Only takes trades in the direction of the selected moving average
- Customizable Parameters: Adjustable length and source for the moving average
Advanced Risk Management
- Multiple Stop Loss Types:
- ATR-based stops with customizable multiplier
- Candle-based stops using previous candle levels
- Fixed point-based stops
- Risk-Reward Optimization: Configurable risk-reward ratios (1:1 to 1:10)
- Breakeven Function: Automatic stop loss adjustment to breakeven after specified R-multiple
- Position Sizing: Percentage-based risk management with automatic position calculation
Time-Based Trading
- Session Filter: Trade only during specified time windows
- London Time Zone: Uses Europe/London timezone for consistency
- Visual Session Highlighting: Optional background fill for active trading hours
Alert System
- Webhook Integration: JSON-formatted alerts for automated trading
- Telegram Support: Pre-formatted messages for Telegram bot integration
- Multiple Formats: Standard, Telegram, and Concise Telegram alert options
- Real-time Notifications: Instant alerts on breakout signals
How It Works
1. Breakout Detection: The script continuously monitors for closes above recent pivot highs or below recent pivot lows
2. DXY Confirmation: When a breakout occurs, the script checks if DXY is moving in the opposite direction with sufficient momentum
3. MA Filter: If enabled, ensures the breakout aligns with the overall trend direction
4. Time Filter: Validates that the signal occurs within the specified trading hours
5. Risk Calculation: Automatically calculates position size based on the defined risk percentage and stop loss distance
6. Trade Execution: Places trades with predetermined stop loss and take profit levels
Unique Advantages
- Multi-Timeframe Approach: Combines asset-specific breakouts with broader USD market sentiment
- False Breakout Reduction: DXY filter helps eliminate breakouts that lack fundamental backing
- Comprehensive Risk Management: Multiple stop loss methods and automatic position sizing
- High Customization: Extensive parameters for different trading styles and market conditions
- Professional Alert System: Ready for automated trading integration
"session high"に関するスクリプトを検索
RTH Candles Overlay--Overview
Unlock a new way to analyze Regular Trading Hours (RTH) with this powerful indicator! Designed for traders who focus on the 09:30–16:00 market session (default EST), it redefines hourly price action by aligning candlesticks with the RTH start at 09:30, rather than the standard XX:00. It also plots hourly high/low lines and projection zones to pinpoint potential support, resistance, and price targets. Plus, it displays compact hourly candlesticks on the right side of your chart for quick, at-a-glance analysis.
--Key Features
Shifted RTH Candles: Unlike standard hourly candles starting at XX:00, this indicator aligns candles with the RTH open at 09:30 (e.g., 09:30–10:30, 10:30–11:30). This captures true market momentum from the opening bell, offering a more accurate view of price action.
Session High/Low Lines: Marks the high and low prices for each session with clear, labeled lines (e.g., “0930-1030 High”) to highlight key levels.
Projection Zones: Draws shaded boxes above and below each session’s range (default: 0.25 and 0.5 Projection levels) to show potential price targets or reversal zones.
Shifted Candlesticks: Displays each shifted Hour as a candlestick (open, high, low, close) on the right side of the chart, with bullish candles in green and bearish in gray for easy comparison.
Vertical Markers: Dotted vertical lines mark the start of each period (e.g., 09:30) for clear time segmentation.
Historical Analysis: View up to 5 days of past sessions to spot trends and recurring levels.
Fully Customizable: Adjust session times, timezone, colors, and projection levels to fit your trading style.
--How It Works
RTH-Aligned Candles: The indicator divides the trading day into up to seven sessions (default: hourly from 09:30 to 16:00 EST). Each session starts at times like 09:30, 10:30, etc., aligning with the RTH open instead of standard hourly intervals. This shift ensures you see price action as it unfolds during key market hours.
High/Low Lines: Horizontal lines mark the highest and lowest prices for each session, with customizable labels for easy reference.
Fibonacci Zones: Shaded boxes extend above (0.25 to 0.5 times the session’s range) and below (–0.25 to –0.5) each session’s high/low, highlighting potential price targets or areas where price may reverse.
Candles: Each shifted hour is summarized as a candlestick on the right side of the chart, showing open, high, low, and close prices. Bullish candles are green, bearish are gray, and you can adjust their size and spacing.
Vertical Lines: Dotted lines at the start of each session (e.g., 09:30) help you visualize session boundaries.
Historical Data: Analyze up to 5 days of past sessions to identify patterns or key levels.
--Settings
Timezone: Set your market’s timezone (default: EST, -4 hours).
Session Times: Customize up to seven sessions (default: hourly from 09:30 to 16:00).
Max Days to Plot: Show up to 5 days of historical sessions (default: 1 day).
Candle Styles: Toggle session candles, adjust width, spacing, and offset. Customize bullish (green) and bearish (gray) colors.
High/Low Lines: Enable/disable high/low lines, set color (default: gray), style (solid, dotted, dashed), and label size. Optionally show session open lines and labels.
Fibonacci Zones: Turn projection zones on/off, adjust levels (default: 0.25 and 0.5), and choose fill color (default: translucent gray).
Vertical Lines: Toggle session start lines and customize their color and style.
--Best Used For
Day Trading: Spot key levels and price targets during RTH sessions, aligned with the 09:30 market open.
RTH Analysis: Get a clearer picture of price action with candles that match the market’s true rhythm, starting at 09:30 instead of XX:00.
Fibonacci Trading: Use projection zones to identify potential support, resistance, or breakout levels.
Session Comparison: Compare price action across sessions using compact candlesticks and historical data.
--How to Use
1. Add the indicator to your TradingView chart (works best on 1-hour or lower timeframes).
2. Set the timezone and session times to match your market (default: 09:30–16:00 EST).
3. Enable/disable features like Fibonacci zones, high/low lines, or session candles in the settings.
4. Use the shaded zones to anticipate price targets or reversals based on Fibonacci levels.
5. Analyze session candles and historical data to spot trends or recurring levels.
--Why This Indicator?
The RTH Session Candles with projection Zones indicator is a game-changer for traders who want to focus on the market’s true rhythm. By aligning candles with the 09:30 RTH open, it captures price action as it happens, unlike standard hourly charts. Paired with projection zones and clear session markings, it’s a simple yet powerful tool to identify key levels and potential price moves. Perfect for day traders, swing traders, or anyone who wants a cleaner, more precise view of the market.

Mavericks ORBMavericks ORB – Opening Range Breakout Zones
Overview:
Mavericks ORB is a fully customizable Opening Range Breakout (ORB) indicator designed for serious intraday traders. It dynamically plots the ORB range for your chosen session and timeframe (5 min, 15 min, or any custom range), projects powerful price zones above and below the range, and automatically includes key midpoints—giving you actionable levels for breakouts, reversals, and dynamic support/resistance.
How It Works:
Configurable Session & Duration:
Choose any session start time and range length (e.g., 5 or 15 minutes) to define your personal ORB window.
Automatic Range Detection:
The indicator marks the high, low, and midpoint of the ORB range as soon as your defined period completes.
Dynamic Zones & Midpoints:
Three replicated price zones are projected both above and below the initial ORB, each calculated using the original ORB’s range and evenly spaced. Each zone includes its own midpoint for nuanced trade management and target planning.
Pre-Market Levels:
Tracks pre-market high and low (with fully customizable colors), giving you crucial context as the regular session opens.
Session Range Visualization:
Highlights the defined trading session with an adjustable background color for easy visual tracking.
Real-Time Info Table:
Displays a summary of all key levels—ORB range, highs, lows, and pre-market levels—right on your chart.
Full Customization:
Adjust all colors, enable/disable session range shading, show/hide labels, and tweak all session settings to fit your trading style.
Key Features:
Select any ORB start time and duration (fully customizable)
Plots ORB High, Low, and Midpoint in real time
Automatically projects 3 zones above and 3 zones below, each with its own midpoint
Pre-market high/low detection and labeling
Configurable session shading for visual clarity
At-a-glance info table with all major levels
Multiple color customizations for all zones and lines
Ready-to-use alert conditions for session and pre-market events
How to Use:
Set your preferred ORB start time and duration (e.g., 9:30 AM, 5 min for US equities).
Watch as the ORB forms and updates in real time.
Once complete, the high, low, and midpoint are plotted.
Monitor the projected zones above and below.
Use these for breakouts, targets, or support/resistance.
Reference the info table for all levels and pre-market context.
Customize as you go: Adjust colors, shading, and session settings to your needs.
Who is this for?
Intraday traders who trade the opening range breakout strategy (stocks, futures, forex, crypto)
Price action traders who want clean, actionable levels
Anyone looking for a reliable, highly visual ORB framework on TradingView
Short Description (for TradingView):
Mavericks ORB is a customizable Opening Range Breakout indicator that plots your session’s high, low, midpoint, and projects three dynamic zones above and below the range including midpoints for powerful trade planning. Includes pre-market levels, session highlights, and a real-time info table. Perfect for intraday price action traders.
What Makes Mavericks ORB Unique?
Flexible: Works with any timeframe or session.
Visual: Clean, uncluttered, and fully customizable.
Strategic: Automatic zone and midpoint projection, not just lines.
Practical: At-a-glance info table and real pre-market context.
Alert-ready: Triggers for session and pre-market events.
If you want to include any tips or a personal note (some script publishers do), you could add:
Tip: Use the midpoints for partial profit-taking or to gauge momentum strength. Adjust your ORB window for different asset classes or volatility environments.

RTH Session Range Position (0-100) with EMAA Pine Script indicator designed to help traders understand where the current price is located within the Regular Trading Hours (RTH) session range, from 0 (session low) to 100 (session high). It also plots a smoothed EMA of this position to provide insight into momentum or trend during the RTH session.
What the Indicator Does
Defines RTH (Regular Trading Hours):
Start: 9:30 AM
End: 4:00 PM
These are typical US equity market hours.
Tracks the session's high and low during RTH:
sessionHigh and sessionLow update only during RTH.
Calculates position of the current price within the RTH range:
Formula: ((close - sessionLow) / (sessionHigh - sessionLow)) * 100
Result is a percentage:
0 = at session low
100 = at session high
50 = middle of session range
Calculates an EMA of that position (posEMA):
Smooths out the raw position to help visualize momentum within the range.
Plots and table:
Plots pos and posEMA on a separate chart pane.
Adds horizontal lines at key levels (0, 30, 50, 70, 100).
Table shows current values for Position, EMA, and Range.
Visual cues:
bgcolor highlights when pos crosses over or under the EMA — potential momentum shifts.
Alerts:
Cross above/below 50 (session midpoint).
Cross above/below EMA.
How to Use It Effectively
1. Session Strength & Momentum
Position above 70: Price is near session highs — strong upward momentum.
Position below 30: Price is near session lows — strong downward momentum.
Use the EMA of position to filter out noise and identify trends.
2. Breakout or Reversal Detection
Cross above EMA: Momentum may be turning bullish.
Cross below EMA: Momentum may be turning bearish.
These crosses (especially near mid-levels like 50) can hint at session trend shifts.
3. Range Context for Entries
If you're a mean-reversion trader, look for:
Price > 70 + turning down below EMA → possible short.
Price < 30 + turning up above EMA → possible long.
For breakout traders, you might wait for:
Crosses above 70 with EMA support.
Crosses below 30 with EMA resistance.
4. Confirmation Tool
Use this indicator alongside others to confirm:
Whether price action has strength within the day.
Whether breakouts have real momentum or are extended already.

Intraday Pivot Highs & Lows (Asia London NY)Intraday Pivot Highs & Lows (Asia London NY)
Script Description
This TradingView indicator is optimized for Forex, scalping, intraday, and day trading strategies. It accurately plots Pivot Points and levels, high/low, support and resistance levels. These are clearly identified to aid the trader during killzone sessions and session opens. Ideal for scalp trading, intraday sessions, and leveraging SMT (Smart Money Techniques). Utilize these Price Levels effectively during London Open, NY Open, and the Asia Session, utilizing Market Structure to pinpoint key levels and reversal zones for successful trading. Improve your Trade Setups, recognize reliable Chart Patterns, identify critical Price Pivots, and trade confidently off Institutional Levels.
This script marks the intraday pivot highs, lows and midpoints retracement levels for
Asia
London
New York
It also plots the previous day's high, low, midpoint, and 0.618 Fibonacci retracement levels, providing traders with critical price reference points for making intraday trading decisions.
Originality & Usefulness
This indicator uniquely integrates pivot calculations across three major Forex sessions (Asia, London, NY), clearly delineating session boundaries.
It enhances visibility by using distinct styling
solid for New York
dashed for London
dotted lines for Asia
And colour co-ordinated labeling, improving traders' ability to identify important intraday price action zones efficiently. Unlike standard pivot indicators, this script emphasizes session-specific trading dynamics.
### Key Features ###
Session-Based Levels: Automatically plots high, low, midpoint, and Fibonacci (.618) levels for each major session (Asia, London, NY).
Distinct Visual Cues: Lines and labels use session-specific styles and colors to easily differentiate between sessions.
Previous Day Reference: Clearly plots and labels yesterday's high, low, midpoint, and Fibonacci levels.
Flexible Visibility: Traders can set timeframe visibility to maintain clean charts on higher timeframes.
### How It Works
At the start of next day's session, previous session lines are cleared, ensuring the chart remains uncluttered.
High, low, midpoint, and Fibonacci retracement levels (.618) are dynamically calculated and displayed at the close of each session.
All session levels remain visible until the start of the next respective session, providing continuous actionable insights.
Trading Application:
Session highs and lows act as strong intraday support and resistance zones.
Midpoints and Fibonacci levels are effective for identifying potential reversal zones and retracements.
Daily levels provide a broader context, useful for gauging intraday volatility and range.
### Limitations and Considerations ##
Best used on liquid assets with clear session-based price action, such as Forex major pairs, if used on indexes make sure they contain 24 hour price action not just New York session.
This indicator is designed to streamline intraday trading by clearly marking essential pivot points and session-based levels, significantly improving traders' market context and decision-making accuracy. Can be used to enhance SMT decision making when scalping killzones.
The Delta with EMAs - Version 2 | CaptJackSparrow📊 The Delta with EMAs - Version 2 16th April 25 working copy it is not finished yet!!!!!!!| CaptJackSparrow
This updated script takes your trading to the next level by merging dynamic volume delta with customizable EMAs and Fibonacci levels, all enhanced with session-based background highlights.
🧩 Cumulative Volume Delta (CVD):
Visualize market sentiment and volume flow with step-line candles, showing the tug-of-war between buyers and sellers.
Real-time tracking of volume dynamics with customizable timeframes and session-specific calculations.
📈 Exponential Moving Averages (EMAs):
EMAs (3, 5, 8, 9, 15, 24, 30, 60, 90) plotted on CVD to reveal trend direction and momentum shifts.
Customizable visibility settings for each EMA, with background coloring when the EMAs align to highlight momentum zones.
📊 Fibonacci Levels:
Overnight and New York sessions: Track the high, low, and midpoint (equilibrium) for each session to gauge market sentiment.
Weekly Fibonacci: See the high, low, and midpoint for the week, with dynamic labels updating as the week progresses.
🌍 Session Highlights:
Display colored backgrounds for New York, Overnight, Europe, Asia, and After Hours sessions, helping you identify active market periods.
Customizable start/end times for each session with visual color options.
🔔 Alerts & Visuals:
EMA crossovers and background colors help spot key momentum shifts.
Tailored alerts based on the crossover of the EMAs, helping you track potential entries or exits.
🧠 Ideal for traders who love:
Understanding market structure through volume analysis.
Using multiple session contexts for more precise trading decisions.
Anticipating breakouts or divergences with dynamic Fibonacci and EMA support.
🏴☠️ Disclaimer: This script is for educational purposes only and is not financial advice. Always trade responsibly and consider market risks.
Mon to Fri + LSE and NYSE📌 Highlight Custom Days & Market Hours Indicator 📌
🔹 Overview:
This script allows traders to visually highlight specific weekdays and market sessions directly on their TradingView charts. With customizable checkboxes, you can choose which days of the week to highlight, along with session times for the New York Stock Exchange (NYSE) and London Stock Exchange (LSE).
🔹 Features:
✅ Select individual weekdays (Monday–Friday) to highlight in blue
✅ Highlight NYSE open hours (2:30 PM – 9:30 PM UK time) in green
✅ Highlight LSE open hours (8:00 AM – 4:30 PM UK time) in orange
✅ Ensures NYSE & LSE sessions are only highlighted on weekdays (no weekends)
✅ Clean and simple visualization for enhanced market awareness
🔹 How to Use:
1️⃣ Add the indicator to your TradingView chart
2️⃣ Use the settings panel to enable/disable specific weekdays
3️⃣ Toggle NYSE or LSE session highlights based on your trading preference
🚀 Perfect for traders who follow institutional sessions and want better time-based confluence in their strategies!
One Trading Setup for Life ICT [TradingFinder] Sweep Session FVG🔵 Introduction
ICT One Trading Setup for Life is a trading strategy based on liquidity and market structure shifts, utilizing the PM Session Sweep to determine price direction. In this strategy, the market first forms a price range during the PM Session (from 13:30 to 16:00 EST), which includes the highest high (PM Session High) and lowest low (PM Session Low).
In the next session, the price first touches one of these levels to trigger a Liquidity Hunt before confirming its trend by breaking the Change in State of Delivery (CISD) Level. After this confirmation, the price retraces toward a Fair Value Gap (FVG) or Order Block (OB), which serve as the best entry points in alignment with liquidity.
In financial markets, liquidity is the primary driver of price movement, and major market participants such as institutional investors and banks are constantly seeking liquidity at key levels. This process, known as Liquidity Hunt or Liquidity Sweep, occurs when the price reaches an area with a high concentration of orders, absorbs liquidity, and then reverses direction.
In this setup, the PM Session range acts as a trading framework, where its highs and lows function as key liquidity zones that influence the next session’s price movement. After the New York market opens at 9:30 EST, the price initially breaks one of these levels to capture liquidity.
However, for a trend shift to be confirmed, the CISD Level must be broken.
Once the CISD Level is breached, the price retraces toward an FVG or OB, which serve as optimal trade entry points.
Bullish Setup :
Bearish Setup :
🔵 How to Use
In this strategy, the PM Session range is first identified, which includes the highest high (PM Session High) and lowest low (PM Session Low) between 13:30 and 16:00 EST. In the following session, the price touches one of these levels for a Liquidity Hunt, followed by a break of the Change in State of Delivery (CISD) Level. The price then retraces toward a Fair Value Gap (FVG) or Order Block (OB), creating a trading opportunity.
This process can occur in two scenarios : bearish and bullish setups.
🟣 Bullish Setup
In a bullish scenario, the PM Session High and PM Session Low are identified. In the following session, the price first breaks the PM Session Low, absorbing liquidity. This process results in a Fake Breakout to the downside, misleading retail traders into taking short positions.
After the Liquidity Hunt, the CISD Level is broken, confirming a trend reversal. The price then retraces toward an FVG or OB, offering an optimal long entry opportunity.
The initial take-profit target is the PM Session High, but if higher timeframe liquidity levels exist, extended targets can be set.
The stop-loss should be placed below the Fake Breakout low or the first candle of the FVG.
🟣 Bearish Setup
In a bearish scenario, the market first defines its PM Session High and PM Session Low. In the next session, the price initially breaks the PM Session High, triggering a Liquidity Hunt. This movement often causes a Fake Breakout, misleading retail traders into taking incorrect positions.
After absorbing liquidity, the CISD Level breaks, indicating a shift in market structure. The price then retraces toward an FVG or OB, offering the best short entry opportunity.
The initial take-profit target is the PM Session Low, but if additional liquidity exists on higher timeframes, lower targets can be considered.
The stop-loss should be placed above the Fake Breakout high or the first candle of the FVG.
🔵 Setting
CISD Bar Back Check : The Bar Back Check option enables traders to specify the number of past candles checked for identifying the CISD Level, enhancing CISD Level accuracy on the chart.
Order Block Validity : The number of candles that determine the validity of an Order Block.
FVG Validity : The duration for which a Fair Value Gap remains valid.
CISD Level Validity : The duration for which a CISD Level remains valid after being broken.
New York PM Session : Defines the PM Session range from 13:30 to 16:00 EST.
New York AM Session : Defines the AM Session range from 9:30 to 16:00 EST.
Refine Order Block : Enables finer adjustments to Order Block levels for more accurate price responses.
Mitigation Level OB : Allows users to set specific reaction points within an Order Block, including: Proximal: Closest level to the current price. 50% OB: Midpoint of the Order Block. Distal: Farthest level from the current price.
FVG Filter : The Judas Swing indicator includes a filter for Fair Value Gap (FVG), allowing different filtering based on FVG width: FVG Filter Type: Can be set to "Very Aggressive," "Aggressive," "Defensive," or "Very Defensive." Higher defensiveness narrows the FVG width, focusing on narrower gaps.
Mitigation Level FVG : Like the Order Block, you can set price reaction levels for FVG with options such as Proximal, 50% OB, and Distal.
Demand Order Block : Enables or disables bullish Order Block.
Supply Order Block : Enables or disables bearish Order Blocks.
Demand FVG : Enables or disables bullish FVG.
Supply FVG : Enables or disables bearish FVGs.
Show All CISD : Enables or disables the display of all CISD Levels.
Show High CISD : Enables or disables high CISD levels.
Show Low CISD : Enables or disables low CISD levels.
🔵 Conclusion
The ICT One Trading Setup for Life is a liquidity-based strategy that leverages market structure shifts and precise entry points to identify high-probability trade opportunities. By focusing on PM Session High and PM Session Low, this setup first captures liquidity at these levels and then confirms trend shifts with a break of the Change in State of Delivery (CISD) Level.
Entering a trade after a retracement to an FVG or OB allows traders to position themselves at optimal liquidity levels, ensuring high reward-to-risk trades. When used in conjunction with higher timeframe bias, order flow, and liquidity analysis, this strategy can become one of the most effective trading methods within the ICT Concept framework.
Successful execution of this setup requires risk management, patience, and a deep understanding of liquidity dynamics. Traders can enhance their confidence in this strategy by conducting extensive backtesting and analyzing past market data to optimize their approach for different assets.

The Ultimate strategy by ATK**The Ultimate Strategy by ATK**
This comprehensive trading script is designed to enhance market analysis and trading strategies by integrating advanced tools for market structure, SMT (Separation and Divergence), Fair Value Gaps (FVG), and session-based insights. With customizable features, real-time alerts, and multi-timeframe functionality, this script caters to both scalpers and long-term traders seeking deeper market insights.
### 🔵 **Key Features**
**🔹 SMT (Divergence) Detection:**
- **High/Low SMT Analysis:** Compares highs and lows between a primary symbol (e.g., NQ1!) and a user-defined comparison symbol (e.g., ES1!).
- Automatically visualizes discrepancies with red (highs) and green (lows) lines.
- Supports two modes: real-time comparison and historical range checks.
- Alerts for detected SMT conditions.
- **Close Price SMT Analysis:** Compares closing prices to highlight divergences.
- Includes user-defined lookback periods and granular cycle-based SMT detection.
**🔹 PSP (Precision Swing Point):**
- Detects and highlights price divergences between symbols, such as NQ and ES, with multi-timeframe compatibility (15-minute, 1-hour, 4-hour).
- Integrated PSP table for visualizing divergences across timeframes.
- Configurable for first PSP detection only or all patterns without lower timeframe interference.
**🔹 Session Analysis with ASIA Session Insights:**
- Tracks high and low prices during the Asia session (1:00–7:00 AM Israel time).
- Draws horizontal lines marking session highs and lows.
- Alerts when prices cross session boundaries.
**🔹 FFMS (First Five-Minute Strategy):**
- Utilizes the high and low of the first five minutes of the trading day.
- Generates buy or sell signals based on retracement and breakout conditions around the previous day’s high/low.
- Real-time alerts for long and short opportunities.
**🔹 Multi-Timeframe Tables and Alerts:**
- Displays SMT and PSP conditions across multiple timeframes (1-minute, 15-minute, 1-hour, etc.).
- Alerts for SMT divergences and PSP patterns across selected time intervals.
**🔹 Visual Enhancements and Customizability:**
- Color-coded lines and labels for easy interpretation of SMT, PSP, and session levels.
- User-friendly input settings for symbol selection, session tracking, and cycle configuration.
- Flexible session range adjustments with macro and micro cycle segmentation (90-minute and 6-hour sessions).
### 🎯 **Use Cases**
- **Scalping:** Analyze short-term divergences with real-time SMT and PSP detection on lower timeframes.
- **Swing Trading:** Leverage session-based insights and SMT conditions to identify potential reversal points.
- **Multi-Symbol Analysis:** Compare key indices or assets (e.g., NQ vs. ES) for SMT-based opportunities.
This script is perfect for traders looking to combine advanced tools into a seamless, actionable trading system. Stay ahead of the markets with **The Ultimate Strategy by ATK**!

Globex time (New York Time)This indicator is designed to highlight and analyze price movements within the Globex session. Primarily geared toward the Globex Trap trading strategy, this tool visually identifies the session's high and low prices, allowing traders to better assess price action during extended hours. Here’s a comprehensive breakdown of its features and functionality:
Purpose
The "Globex Time (New York Time)" indicator tracks price levels during the Globex trading session, providing a clear view of overnight market activity. This session, typically running from 6 p.m. ET (18:00) until the following morning at 8:30 a.m. ET, is a critical period where significant market positioning can occur before the regular session opens. In the Globex Trap strategy, the session high and low are essential levels, as price movements around these areas often indicate potential support, resistance, or reversal zones, which traders use to set up entries or exits when the regular trading session begins.
Key Features
Customizable Session Start and End Times
The indicator allows users to specify the exact start and end times of the Globex session in New York time. The default settings are:
Start: 6 p.m. ET (18:00)
End: 8:30 a.m. ET
These settings can be adjusted to align with specific market hours or personal preferences.
Session High and Low Identification
Throughout the defined session, the indicator dynamically calculates and tracks:
Session High: The highest price reached within the session.
Session Low: The lowest price reached within the session.
These levels are essential for the Globex Trap strategy, as price action around them can indicate likely breakout or reversal points when regular trading resumes.
Vertical Lines for Session Start and End
The indicator draws vertical lines at both the session start and end times:
Session Start Line: A solid line marking the exact beginning of the Globex session.
Session End Line: A similar vertical line marking the session’s conclusion.
Both lines are customizable in terms of color and thickness, making it easy to distinguish the session boundaries visually on the chart.
Horizontal Lines for Session High and Low
At the end of the session, the indicator plots horizontal lines representing the Globex session's high and low levels. Users can customize these lines:
Color: Define specific colors for the session high (default: red) and session low (default: green) to easily differentiate them.
Line Style: Options to set the line style (solid, dashed, or dotted) provide flexibility for visual preferences and chart organization.
Automatic Reset for Daily Tracking
To adapt to the next trading day, the indicator resets the session high and low data once the current session ends. This reset prepares it to start tracking new levels at the beginning of the next session without manual intervention.
Practical Application in the Globex Trap Strategy
In the Globex Trap strategy, traders are primarily interested in price behavior around the high and low levels established during the overnight session. Common applications of this indicator for this strategy include:
Breakout Trades: Watching for price to break above the Globex high or below the Globex low, indicating potential momentum in the breakout direction.
Reversal Trades: Monitoring for failed breakouts or traps where price tests and rejects the Globex high or low, suggesting a reversal as liquidity is trapped in these zones.
Support and Resistance Zones: Using the session high and low as key support and resistance levels during the regular trading session, with potential entry or exit points when price approaches these areas.
Additional Configuration Options
Vertical Line Color and Width: Define the color and thickness of the vertical session start and end lines to match your chart’s theme.
Upper and Lower Line Colors and Styles: Customize the appearance of the session high and low horizontal lines by setting color and line style (solid, dashed, or dotted), making it easy to distinguish these critical levels from other chart markings.
Summary
This indicator is a valuable tool for traders implementing the Globex Trap strategy. It visually segments the Globex session and marks essential price levels, helping traders analyze market behavior overnight. Through its customizable options and clear visual representation, it simplifies tracking overnight price activity and identifying strategic levels for potential trade setups during the regular session.

Sessions KillZones Library [TradingFinder]🔵 Introduction
"The Forex Trading Sessions" highlight the active periods across different markets where significant trading volume and influence on the forex market are evident. The primary trading sessions globally include the "Asian Session," "London Session," and "New York Session."
A "Kill Zone" refers to a segment within a session characterized by high trading volume and notably sharper price movements. Consequently, there's a higher probability of encountering price action setups within these zones. Traders capitalize on this phenomenon in pursuit of more successful trading outcomes.
If you aim to integrate sessions or kill zones into your indicators or strategies, utilizing this library can amplify the precision and efficiency of your Python script development.
🔵 How to Use
First, you can add the library to your code as shown in the example below:
import TFlab/SessionAndKillZoneLibrary_TradingFinder/1
🟣 Parameters
SessionDetector(Session_Name, Session_Time, KillZone_Time, Session_Show, KillZone_Show, AreaUpdate, MoreInfo, Session_Color, Info_Color) =>
Parameters:
•Session_Name (string)
•Session_Time (string)
•KillZone_Time (string)
•Session_Show (bool)
•KillZone_Show (bool)
•AreaUpdate (string)
•MoreInfo (bool)
•Session_Color (color)
•Info_Color (color)
Session_Name : You must enter the session name in this parameter.
Session_Time : Enter here the start and end time of the session, which should be based on the UTC time zone.
KillZone_Time : Enter the start and end times of the kill zone, which should be based on the UTC time zone, here.
Session_Show : You can control whether or not to show the session using this entry. You must set true to display and false to not display.
KillZone_Show : Using this input you can control whether the kill zone is displayed or not. You must set true to display and false to not display.
AreaUpdate : If you want the session to be determined based on the time and high and low of the session itself, you must enter "Session" and if you want the area to be determined based on the time and high and low of the kill zone, you must enter "Kill Zone".
MoreInfo : If you want more information, you should set this entry to true, otherwise set to false. This information includes the number of candles in the area, the length of time in the area and the volume of transactions in the area.
Session_Color : Enter your desired color to display the session at this section. It is recommended to use bright and sharp colors.
Info_Color : Enter your desired color to display more information in this section.
🔵 Function Outputs
The outputs of this function are direct and indirect.
🟣 Indirect outputs
These outputs include session display, kill zone display, and time and volume information of session or kill zone.
🟣 Direct outputs
There are 8 direct outputs, which are:
Session Time : If the Session is active, it outputs 1, and if the Session is inactive, it outputs 0.
Kill Zone Time : If the Kill Zone is active, it outputs 1, and if the Kill Zone is inactive, it outputs 0.
Open : Session opening price.
High : The highest price of the session.
Low : The lowest price of the session.
Close : The last price of the session.
Low Touch Alert : If "Area Update" is in "Kill Zone" mode, if the price reaches the lowest price of the kill zone in the same session after the end of the kill zone, this output will be true. You can use this output to create an alert.
High Touch Alert : If "Area Update" is in "Kill Zone" mode, if the price reaches the highest price of the kill zone in the same session after the end of the kill zone, this output will be true. You can use this output to create an alert.
Important : To use "Open", "High", "Low" and "Close", "Area Update" must be in "Session" mode.

NITS - NIFTY INTRADAY TRADING SYSTEMNSE:NIFTY
Hello Traders..!
This is another indicator / system to make use for NIFTY & BANK NIFTY Intra day trading.
This is my Gift to the traders for this New Year 2024. Use this to your Edge and make some profits. All explained below.
NIFTY INTRA-DAY TRADING SYSTEM
Explanation of Arrays:
-------------------------------
## FIRST 15 MIN SESSION BOX ##
From 09:15 to 09:30 where the initial orders will get collected and Auction takes place.
DO NOT engage into any trade in this session. Let the Box develop.
## INITIAL HIGH / LOW FORMATION SESSION ##
This session is from 09:15 to 10:30.
We can observe the Initial High or Low being formed for the day, that is VALID TILL 11:30.
## NO-TRADE ZONE / ACC. AREA / DAY’S H OR L CONFIRMATION SESSION ##
From 11:30 to 12:30
90% of time this is the session where the whole Day’s High or Low will get confirmed. Sometimes the market may violate this Session!
DO NOT engage into any fresh trade in this area.
Once the box is developed, you can see the Mid price line will be formed which is valid for the afternoon Trading session till 15:30.
## SIGNAL LINE, MIDDLE PRICE LINE, SESSION HIGH LOW LINES ##
Middle Price Line – the dotted line (Red colour) is Mid Price Line for the Initial session box. This acts as an important price level for the whole day.
Signal Line – the Solid line that will form after 10:30. Consider this price line as very important price line to which the price reacts with a good momentum, either break through or rejection and valid for the whole trading day.
Session High Low price line – high and low prices of the Initial session box which acts as a good Support / Resistance / Target / Stop loss. Even previous session’s price lines can also be used for the current day too.
## TREND BOX ##
Multi-Time frame trend box will show the real-time trend on different time frames. This box will be very helpful in trade decision. Please note that at least THREE HIGHER TIME FRAME TRENDS must be in the same direction to support your trade criteria for the better confirmation.
## VOLUME IMBALANCE ##
These orange coloured boxes are very tiny imbalances between prices that were formed during price movements. Algorithm will try to fill these imbalances on its way of filling orders. These price imbalances can be used for our edge while taking trades.
SOME TIPS:
---------------------------
1) Avoid Break out trades
2) Always trade the pull backs
3) Keep your Stops above / below the KEY LEVELS
4) Always follow the Higher Time frame trend while taking a trade.
If you trade in 1m TF consider 5m trend
If you trade in 5m TF consider 1H or 15m trend
5) Consider the higher TF closure of prices only, to validate the break out.
6) Trade what you see, market can do anything it wants.
7) Do not worry about losses. It happens and that is the business.
8) End your trading week in green no matter how big or small the profit is. Consistency is the key this business.
9) Keep in mind that the Market does two things only, either it will FILL THE GAP or GRAB THE LIQUIDITY. Just plan your trades accordingly. Liquidity levels like Previous Session / Day / Week / highs and lows.
10) The Market is a continuous business. It does not end for the specific day. It will not end its Buy or Sell model unless it completes its cycle, hence TRADE WHAT YOU SEE and not WHAT YOU THINK!
11) Unless the key swing high / low is broken and closed, DO NOT consider that move as a reversal. Consider that as a Liquidity grab. And it will continue in its previous trend.
HOW TO TAKE TRADE USING NITS: (one of the Techniques)
--------------------------------------------------------------------------------
As explained above, Do not engage in trade for the first 15 minutes.
Once the 15m box forms then look for divergence between NIFTY and BANK NIFTY.
Both Indices are supposed to trade in the same direction but at key levels and times, these instruments will make DIVERGENCE with its Highs and Lows.
Ex: one Index will make LOW AND LOWER LOW and at the same time other will make LOW AND HIGHER LOW. This deflection can be used for taking Buy Trades.
Ex:
If the Divergence forms at the Bottom then the market will move upwards.
If the Divergence forms at the Top then the market makes down move.
To confirm this divergence, the price will move away from that deflected Lows or Highs.
-----------------------------------
POINTS TO OBSERVE
------------------------------------
Mostly the first 15 min range that forms will either be very large candles or normal candles with rejection wicks or Shaved bar (open and H/L same)
Whenever you observe a very large wide range bars within the 15min range, consider the Day’s high and Low is already formed. And the market will be hovering inside that range only. Very useful for taking 50 points scalping here and there by using the signal line and middle line or Acc box mid line. In this scenario you have three important info of the day, OPEN HIGH & LOW established already, The market will only look for its close.
Ex:
If the market trades with normal candles, then consider your trades in two parts.
From 09:30 to 11:30 and from 12:30 to 15:30 as 11:30 to 12:30 will confirm the current day’s High / Low hence do not take a fresh position within that time.
1) Initial session trade – If the price does not break and close the 15 min range high/low, consider it is going to reverse and continue its trend till 10:30
Ex:
2) Mid session Trade – mostly the market accumulates positions and collects orders between 11:30 to 12:30 for the afternoon session. Once the session box is developed, the middle price line will form. Wait for the market breakout and close off this session’s high or low in Higher TF. The market will continue in the direction of breakout from this session and continue till 15:30. Hence wait for pull back till its mid price / high or low price lines of this Acc box and take trade in the initial breakout direction keeping stop above or below the session’s high or low.
Ex:
## Fixed Range Volume Profile as a Tool ##
-----------------
Note:
-----------------
Kindly do not ask for any codes or script details. The one technique what I explained (Divergence method) is more than enough for making a consistent earnings. Please study and back test / forward test for yourself for atleast 2 weeks time. Every traders aspect and mindset is different in seeing the market movements. Please design your own methodology and CONSIDER this as a BUSINESS..!
JUST.....
Believe the System
Be patient
Be Disciplined &
Be a Successful Earner..!!
LET YOUR ENDS MEET
(Hope I explained well)
Diddly - Charts (Asian, London & New York Session + Weekdays)Overview:
Diddly Charts is for providing intraday context to where we are in the market. It does this through a series of ranges displayed throughout the day, typically broken down into the Asian, London, and New York sessions.
This indicator also highlights key market structures like monthly, weekly, and previous day's highs and lows. Lines are provided for weekday and weekend separators, with the days of the week at the bottom of the chart, making it extremely useful for traders when identifying weekly cycles.
Usage:
All aspects of this indicator are changeable within the settings, allowing you to utilise the elements that are most important to your trading strategy.
The default layout is extremely useful for currency pairs, where traders use the London and New York boxes as windows of when to engage with the market. The times of these trading sessions can be changed to suit the trading periods that you want to trade.
Adhering to trading windows can help improve discipline to ensure that you are only taking entries within the time periods that match your trading strategy.
Some traders prefer a cleaner interface and don't want any indicator to detract from the price action they are reading, this can be achieved through changing the colour and their transparency in settings. In this example, you will see different labels used to annotate key structures, these can be changed to something that is relevant to your strategy in the settings.
It can also be used for trading Stocks where sessions are broken down into pre-market, market hours and post-market. This can be helpful to see those stocks that breakout of pre-market session highs and lows and also provide trading windows to keep traders out of trades that do not comply with their trading strategy.
Using higher time frames like a 4 hour chart or even the 1 hour chart, the intraday sessions are hidden away so traders can get a broader perspective without the clutter when zooming out. Although there are options to turn it on if you would prefer.
Here on a zoomed out 1 hour chart we have the option to only display the weekly line separator, which can help get an overview of weekly cycles.
Helpful Information
The main setting that you may want to change is at the top of the indicator settings, which is asking "what asset type" is the symbol being looked at. The indicator needs to know how to display the session range information. For example for currencies, the range size will be displayed in pips. For stocks or Futures it would display the financial amount. Beyond the visual display of information, this setting has no other impact on the indicator behaviour. The default setting is "Currencies".
We often get asked what the labels that appear on the chart mean. These can all be changed to your requirements, but by default what you will see when you apply the indicator to the chart is:
Under the Asian Range appears a couple of labels.
A = x : This is the range size of the session in pips for forex or amount for other assets, from the lowest to the highest price traded during that window.
ADR = y : This is the Average Daily Range over the last 21 days for this ticker
Under the London and New York session you will see a L = x or NY = y . This is the range size of each session in pips for forex or amount for other assets.
Structure Labels
YH = Yesterday's High
YL = Yesterday's Low
WH = Current Week's High
WL = Current Week's Low
MH = Current Month's High
ML = Current Month's Low
We greatly appreciate the support and feedback from the Trading View community, and we are dedicated to continuing to improve our indicators with your support.
We want to help you manage risk, and that's why we emphasise that trading is risky and any technology used to support our trading decisions is based on information from the past. We encourage traders to take responsibility for their trading businesses and always prioritise risk management.

Musashi_BattleTimer-Musashi_Battle Timer-
Four financial sessions presented in a compact way that suits my trading style.
The indicator will do the following:
- Plot Background color separating sessions:
- Highlight Gray since Tokyo open to London open, then a gap.
- Highlight Red from London open to NY open, then a gap.
- Highlight Red from NY open to London Close, then a gap
- Highlight Gray from London close to Sidney open
- Sidney open to Tokio open NO highlight.
- Plot dotted limits for the highest and lowest price of the day.
- Plot a range for the Asian session (Sydney + Tokyo).
- Plot a few day's ADR (Average Daily Range) and extend the current one.
Have a good day.
ICT Killzones & Pivots indicatorIt marks out key trading sessions (Asia, London, New York AM, NY Lunch, NY PM) by drawing:
Killzone boxes (high/low of session)
Pivot lines (session highs and lows)
Labels (like LO.H, NYAM.L, etc.)
Day/Week/Month opens and separators
Custom timestamp markers
Here’s what’s happening in the code:
🔑 Key Features:
Configurable Killzones
Asia: 20:00 – 00:00 GMT-4
London: 02:00 – 05:00 GMT-4
NY AM: 09:30 – 11:00 GMT-4
NY Lunch: 12:00 – 13:00 GMT-4
NY PM: 13:30 – 16:00 GMT-4
Each session can show:
Colored boxes (range of session)
Pivot high/low lines
Labels like AS.H, LO.L
Alerts when levels break
Drawing Limits
max_days input controls how many past sessions are shown.
Prevents chart clutter.
Opening Price Lines
You can mark important open levels: true day open (00:00), 06:00, 10:00, 14:00.
Useful for ICT concepts like “open drive.”
Day/Week/Month Opens
Option to plot open price levels with labels (D.OPEN, W.OPEN, M.OPEN).
Can also show separators for each new day/week/month.
Alerts
Triggers when session highs or lows are broken.
Example: “Broke LO.H” if London high breaks.
Custom Timezones
Killzones are adjusted using the gmt_tz setting.
Default is GMT-4 (New York).
Cutoff Time
After a set time (default 12:00), extensions of session lines stop updating.
⚡ In practice:
Boxes highlight accumulation ranges (ICT killzones).
Pivot lines help track liquidity grabs (session high/low breaks).
Labels + alerts keep you notified of important market structure events.
Combined with ICT concepts, you’d look for setups like:
London killzone sweep of Asia range.
NY session taking liquidity above London high.
ORB Breakouts with alerts"ORB Breakouts with Alerts" is a utility indicator that highlights an Opening Range Breakout (ORB) setup during a user-defined intraday time window. It allows traders to visualize price consolidation ranges and receive alerts when price breaks above or below the session high/low.
🔧 Features:
*Customizable session time (start and end), adjustable to local time using a timezone offset.
*Automatically plots:
*A shaded box around the session's high and low.
*Horizontal lines at session high and low levels.
*Optional "BUY"/"SELL" labels to mark breakout directions.
*Visual breakout signals when price crosses above or below the session range.
*Built-in alerts to notify when breakouts occur.
*Configurable styling options including box color, highlight color, and label placement.
⚙️ How It Works:
*During the defined time range, the script tracks the highest high and lowest low.
*After the session ends:
*A box is drawn to represent the opening range.
*Breakouts above the high or below the low trigger visual markers and optional alerts.
*Alerts are limited to one per direction per day to reduce noise.
⚠️ This indicator is a technical analysis tool only and does not provide financial advice or trade recommendations. Always use with proper risk management and in conjunction with your trading plan.

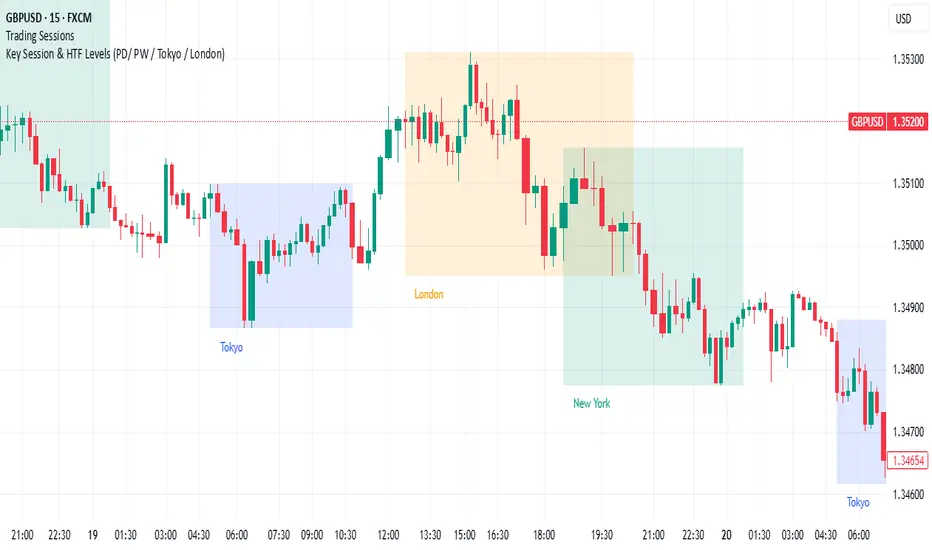
Key Session & LevelsThis indicator helps traders track key price levels for multiple timeframes and trading sessions. It plots:
Previous Day's High and Low (PD): Highlighting the high and low of the previous trading day.
Previous Week's High and Low (PW): Plotting the highest and lowest price levels for the past week.
Tokyo Session High and Low (Today): Displays the high and low levels for the Tokyo trading session (adjustable to your preferred time window).
London Session High and Low (Today): Tracks the high and low for the London trading session (also adjustable for your timezone and desired session window).
Features:
Customizable Time Zones: The indicator uses your preferred timezone to calculate session highs/lows.
Extendable Lines: Lines for each level extend to the right of the chart, providing continuous reference throughout the trading day.
Adjustable Settings: Fine-tune the visibility and width of the lines, and choose which levels to display (Previous Day, Previous Week, Tokyo, and London sessions).
Non-Repainting: This script uses historical data and only updates when new bars are confirmed, ensuring accurate and reliable signals.
Whether you're a day trader, swing trader, or just tracking key levels for strategic entries and exits, this tool provides quick visual reference to important price points across different trading sessions.
SMT for Time-Based Sessions [ufo]SMT for Time-Based Sessions identifies when one asset breaks a session’s high/low while another correlated asset fails to do so. This imbalance often signals engineered liquidity grabs, reversals, or continuation setups. By focusing on divergences within specific trading sessions (London, New York AM, Lunch, New York PM, Asia, Daily or your own custom windows), the tool filters out noise and pinpoints only the most meaningful SMT divergences across multiple symbols in real-time.
Core Concept:
SMT (Smart Money Technique/Tool/Time) is a concept popularized by Inner Circle Trader (ICT) that suggests that when correlated or inversely correlated instruments fail to confirm each other's price movements (e.g., one breaks a high/low while the other doesn’t), it often indicates:
Liquidity manipulation by institutional players
Potential reversal points in the market
Weakness or strength in the current trend
Stop hunt operations before significant moves
This indicator identifies these divergences by comparing your chart symbol against up to two comparison symbols across different sessions and timeframes.
How Time-Based SMT Works:
Unlike basic divergence tools, this indicator is built specifically for Session-Based and Timeframe-Based SMT tracking. It continuously monitors intraday sessions and higher timeframes, then plots divergences the moment they occur.
Time-Based Session SMT
Session Tracking: Monitors highs and lows during each session
Post-Session Analysis: After a session ends, tracks whether price breaks session levels
Divergence Detection: When the main symbol breaks a high/low but comparison symbols don’t (or vice versa), an SMT signal is triggered
(e.g. Nasdaq traded above London high while S&P500 does not)
Visual Confirmation: Lines connect the session reference to the current extreme, with labels showing the diverging session, high/low, and symbol, this information is also displayed in the Info Panel
This will update if a new high/low extreme is made while the SMT is still valid, if invalidated these will be removed from the chart
Example:
This NQ chart includes ES and YM as comparison symbols. At 03:20 AM New York time, both ES and YM broke the Asia session low (20:00 – 00:00), while NQ did not. This creates a bullish session divergence , which the indicator immediately detects and plots.
Although the chart shows three symbols for illustration, you don’t need to manually monitor comparison charts when using this indicator, the SMT divergence will be plotted automatically as soon as it occurs
Consecutive Candle SMT (CC SMT)
Previous Candle Reference: Uses the previous candle's high/low from the selected timeframe
Real-Time Comparison: Monitors if current price breaks these levels across all symbols
Instant Detection: Triggers SMT immediately when divergence occurs
Dynamic Updates: Lines and labels update in real-time as new extremes form and are automatically removed if invalidated
Example:
Here I configured CC SMT Timeframe 1 to monitor the previous 4-hour candle’s high/low. On this NQ chart with ES as a comparison symbol, ES broke above the prior 4-hour high at 14:00 New York time, while NQ did not, showing relative weakness creating a bearish CC SMT divergence
This chart is just an illustration. The indicator will automatically plot SMT divergences on your main chart, regardless of the timeframe you’re viewing
How To Use:
This indicator is not a buy/sell signal on its own. Instead, it is designed to highlight Time-Based SMT divergences so you can combine them with your existing trading strategy or model. It should be used as an extra layer of confluence, helping you confirm trade ideas.
Select your comparison symbols
For example:
Futures: NQ vs ES/YM
Forex: EURUSD vs GBPUSD/DXY(inversely)
Crypto: BTC vs ETH
Commodities: Gold vs Silver
Choose which sessions or candle timeframes you want the indicator to monitor
Watch for divergences the indicator plots when one symbol breaks a high/low while the other does not
Use these divergences as confluence, alongside your own strategy and risk management rules
Key Features:
Multiple Comparison Symbols
Symbol 1 & Symbol 2: Compare your main chart against up to 2 correlated instruments
Symbol Inversion: Perfect for inversely correlated pairs (e.g., EURUSD vs DXY)
Session-Based SMT Tracking
Monitors 7 fully customizable trading sessions with the default being:
London Session (2:00-5:00 NY time)
NY AM Session (9:30-12:00 NY time)
Lunch Session (12:00-13:00 NY time)
NY PM Session (13:00-16:00 NY time)
Asia Session (20:00-00:00 NY time)
Custom Session 6 (if you want to add an extra session)
Daily Session (18:00-18:00 NY time)
Fully customizable session times and names
Automatically detects when the main symbol breaks a session high/low while comparison symbols don't (and vice versa)
Consecutive Candle SMT (CC SMT)
Monitors 3 customizable timeframes
Tracking of divergences based on specific timeframe candles (15min, 60min, 4 hour, weekly, etc.)
Identifies when the current price breaks the previous candle's high/low differently than comparison symbols
Maintains history of past SMTs (configurable)
Timeframe 3 supports custom time shifts for non-standard candle boundaries
Example: 90min timeframe with a +60 shift changes the candle range from:
00:00-01:30, 01:30-03:00 etc
to:
01:00-02:30, 02:30-04:00 etc
Visual Customization
Line Styles: Customize the line styles for different symbols
Colors: Unique color schemes for instant session identification
Adjustable Offsets: Fine-tune label positions with multiplier settings
Show/Hide Controls: Complete control over visual elements
Custom Labels: Customize the SMT labels for highs and lows
Information Panel
Active SMT Conditions: Live tracking of all current divergences
Session Names: Clear identification of which session created the SMT
Symbol Information: Shows which comparison symbol is diverging
Timestamps: Optional time display showing when SMT was first detected
Flexible Positioning: 8 different panel positions
Smart Display Modes: Options to hide inactive sessions/timeframes
Alert System
Configurable alerts for specific sessions or timeframes
Get notified when new divergences appear instantly
Clear, informative alert descriptions
How To Setup Alerts:
Enable the "Enable Alerts" in the settings
Choose which sessions/timeframes to receive alerts for by choosing it in the setting below
(If you select "All Sessions" you will only be alerted for all the sessions you have enabled in the indicator settings)
Create an alert (ALT+A shortcut) or click the the 3 dots on the indicator "Add alert on Session SMT "
- Condition = Session SMT
- Function = Any alert() function call
- Alert name (Message) = Anything you prefer (e.g. SMT Alert)
If you want to create another alert for different settings, first input the new settings in the indicator, then create a new alert.
Note: Previous alerts will continue to notify you based on the settings they were originally set for, even if you change the indicator setting.
How This Helps Your Trading:
This tool automates the heavy lifting of tracking divergences across multiple markets and sessions, continuously monitoring highs and lows in real time and plotting only the most meaningful SMT signals so you can focus on execution, not chart-watching.

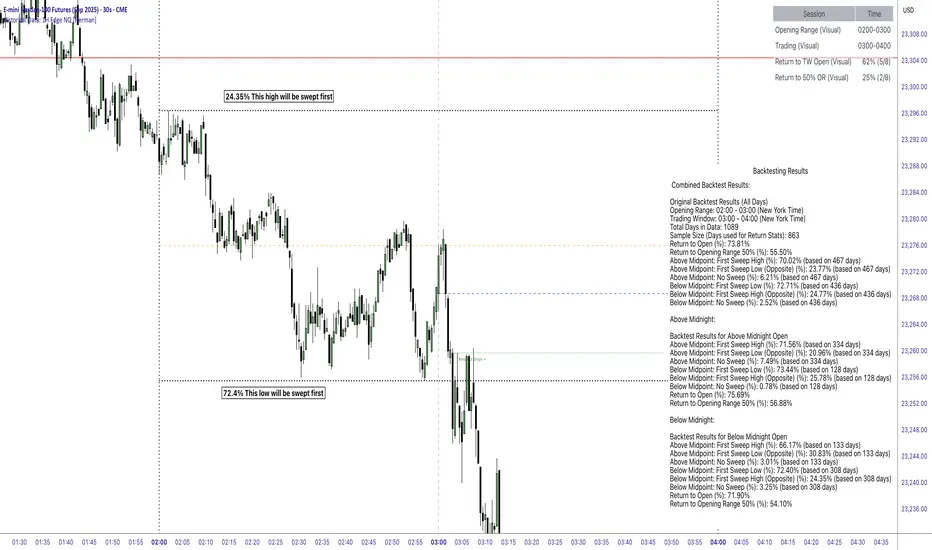
Historical Data: 1H Edge NQ [Herman]Historical Data: 1H Edge NQ
This Pine Script indicator is designed to provide traders with visual tools and historical statistical insights for analyzing hourly price behavior on the Nasdaq-100 futures (NQ) contract.
It focuses on key concepts such as Opening Ranges (OR) and Trading Windows (TW), drawing from established trading principles like session-based ranges and return probabilities.
This unique indicator stands out by incorporating pre-computed statistics derived from over 4 years of 1-minute timeframe data, offering detailed hourly probabilistic insights in an editable sticky note format—making it a distinctive tool for in-depth analysis.
The goal is to help users visualize potential price dynamics and assess historical tendencies, enabling more informed decision-making based on past data patterns.
All calculations are based on historical price action, and the indicator does not make predictions or generate trading signals—it simply displays pre-computed statistics and visual aids for educational and analytical purposes.
Key Features and Visual ElementsVertical Lines for Time Sessions:
Orange Line - Opening Range Midline (50%)
Horizontal Dotted Lines - Opening Range High and Low
Solid Red Line - Midnight Open
Dashed Vertical lines - Opening range and trading window start/close times
Blue Dashed Line - Trading Window Candle Open
The indicator marks the start of the user-selected Opening Range (OR) and Trading Window (TW) with customizable vertical lines.
These represent the time periods where the OR is formed (e.g., 02:00-03:00 NY time) and where trading activity is observed (e.g., 03:00-04:00 NY time).
Users can adjust these sessions via inputs for flexibility across different hours.
-Horizontal Lines for Price Levels:Opening Range High and Low:
-Solid or dashed lines (customizable) show the high and low of the selected OR, extended horizontally to highlight potential support/resistance levels during the TW.
-50% OR Midpoint: An optional dashed line at the midpoint (50%) of the OR, which serves as a reference for mean reversion analysis.
-Trading Window Open Price: A line marking the open price at the start of the TW, useful for tracking returns to this level.
-Midnight Open (Red Line): A dedicated red horizontal line indicating the open price at midnight (00:00 NY time), which acts as a daily reference point for overnight price action.
Statistical Display via Sticky Note and Table:A customizable "Sticky Note" table displays pre-computed backtest results for the selected OR hour, including sections for combined results, above-midnight scenarios, and below-midnight scenarios. Content is user-editable via inputs.
A main info table shows session details, total historical sessions, and probabilities for returns (if enabled).
Customization Options: Users can toggle visuals, adjust colors, styles, widths, positions, and themes (light/dark). The indicator supports up to 500 lines/labels/boxes for historical drawing.
Logic and PrincipleThe indicator operates on a per-hour basis, treating each hour (0-23 NY time) as an independent "session" for analysis:Session Definition:
For any given hour (e.g., 02:00), the OR is the high/low range formed in that hour.
The TW is the subsequent hour where price action is tracked.
Tracking Price Action: During the TW, the script checks if price "sweeps" (crosses) the OR high or low. It then monitors for "returns"—instances where price crosses back to the TW open price or the 50% midpoint of the OR after a sweep.
Statistical Calculation: Probabilities are derived from historical counts:Total sessions: Number of historical days where data was available for that hour.
Return to TW Open: Percentage of sessions where, after sweeping OR high/low, price returned to the TW open (calculated as returns / total sessions with sweeps).
Return to 50% OR: Similar percentage for returning to the OR midpoint.
These are computed cumulatively across all historical bars loaded on the chart, resetting flags daily to ensure independence per session. No real-time predictions are made; stats accumulate from past data.
Midnight Open Integration: The red line resets daily at 00:00 NY, providing context for overnight gaps or continuations.
Breakout Origin: Scans recent bars for conditions where a breakout from OR occurs without opposite direction breach, drawing lines to the origin bar's open for visual reference.
The core principle is rooted in range-based analysis, a common technical approach where traders observe how price interacts with session highs/lows and midpoints.
By quantifying historical return rates after sweeps, the indicator highlights tendencies like mean reversion or continuation, but all insights are retrospective and depend on the loaded data.
Data Source and BacktestingThe statistical data embedded in the sticky notes (e.g., return percentages, sweep rates) was generated using Python in a Jupyter Notebook environment.
It analyzes approximately 1089 days (about 4 years) of 1-minute historical data for NQ futures, sourced BacktestMarket.
The backtests focused on NY time sessions, calculating metrics like:Sweep rates (e.g., first sweep high after above-midpoint open).
Return probabilities post-sweep.
Conditional splits (above/below midnight open).
These pre-computed values are hardcoded into the script via text areas for display, ensuring transparency.
Note: Historical performance is not indicative of future results; this is for analytical reference only.
Purpose and UsageThis indicator aims to assist traders in evaluating price direction potential by combining visual session markers with historical probabilities.
For example:If historical data shows a high probability of returning to the 50% OR after a sweep, it might suggest monitoring for mean reversion.
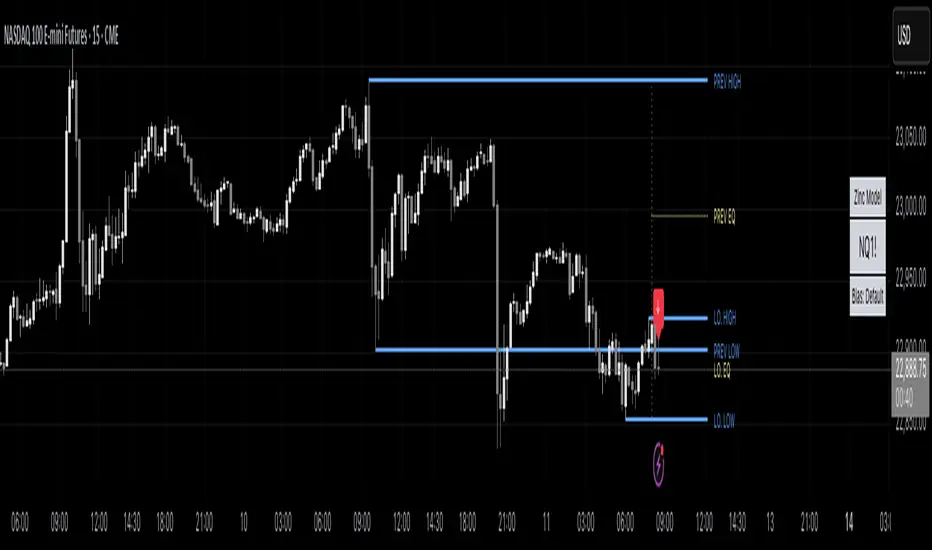
Zinc Model [Mr Zinc x MMT]The Zinc Model is a TradingView indicator designed to assist traders by plotting key price levels from two defined trading sessions: the previous day's session (4:00 AM to 8:00 PM) and the current day's London session (4:00 AM to 9:15 AM). It overlays horizontal lines for session highs, lows, and midpoints (EQ levels), along with a vertical anchor line to mark session starts. The indicator is highly customizable, allowing traders to tailor its appearance and focus on specific sessions for strategic analysis.
Features
Session-Based Levels : Tracks and displays high, low, and midpoint (50% EQ) levels for two sessions: the previous day's session and the current day's London session.
Customizable Display : Users can toggle visibility of high, low, EQ levels, and session anchor lines, with options to adjust line styles, colors, and widths.
Session Selection : Configurable session show times (default: 8:00 AM to 4:00 PM in New York time) for displaying levels, with a projection offset to extend lines into future bars.
Labels: Optional labels for each level (High, Low, EQ) with customizable sizes (Tiny, Small, Normal, Large) for clear identification.
Time Zone Support : Anchors sessions to a specified time zone (default: America/New_York).
How It Works
The indicator calculates key price levels based on two user-defined sessions:
- Previous Day Session (4:00 AM–8:00 PM) : Tracks the high, low, and midpoint (50% of the range) of the previous day's session.
- London Session (4:00 AM–9:15 AM) : Tracks the high, low, and midpoint of the current day's London session.
- Levels Displayed :
High/Low Levels : Horizontal lines at the highest and lowest prices of each session.
EQ Level : A horizontal line at the 50% midpoint of the session's range.
Anchor Line : A vertical line marking the start of the user-defined display session.
- Levels are plotted during a user-specified "Show Session" time window (default: 8:00 AM–4:00 PM) and extended forward by a configurable number of bars (default: 15).
- The indicator updates dynamically as new highs or lows occur within the active session.
Usage
- Add to Chart : Apply the indicator to any TradingView chart.
- Configure Settings :
Session Settings : Adjust the "Session Show Time" (default: 8:00 AM–4:00 PM) and time zone to align with your trading strategy.
Projection Offset : Set the number of bars to extend level lines into the future.
Anchor Line : Toggle the vertical line at session start and customize its style, color, and width.
High/Low/EQ Levels : Enable or disable lines and labels for each session's high, low, and midpoint, and customize their appearance.
Label Size : Choose from Tiny, Small, Normal, or Large for level labels.
- Interpret Levels :
High/Low Lines : Act as potential resistance (high) or support (low) levels.
EQ Line : Represents the session's midpoint, often a pivot point for price action.
Anchor Line : Marks the start of the display session for context.
- Trading Application : Use levels to identify support/resistance zones, set entry/exit points, or confirm breakouts during the specified session.
Settings
- Session Settings :
Session Show Time : Defines when levels are displayed (default: 8:00 AM–4:00 PM).
Projection Offset : Extends lines forward (default: 15 bars).
Time Zone : Sets the session time zone (default: America/New_York).
- Anchor Line Settings : Toggle visibility, style (Solid, Dashed, Dotted), color, and width.
- High/Low/EQ Settings : Separate controls for previous day and London sessions to toggle visibility, adjust line styles (Solid, Dashed, Dotted), colors, widths, and label visibility.
- Label Size : Options for Tiny, Small, Normal, or Large to adjust label appearance.
Ideal Use Case
The Zinc Model is ideal for day traders and swing traders focusing on session-based price action, particularly those trading forex, indices, or other markets with significant activity during the London session. It helps identify key support, resistance, and pivot levels for intraday strategies, with flexible settings to suit various timeframes and trading styles.
Black Box Trading Measuring Tool (BlackBox - BBT)Overview
The Black Box Trading Indicator is a comprehensive technical analysis tool that combines multiple trading concepts into a single, powerful indicator. It displays custom session ranges, Average Daily Range (ADR) projections, support/resistance levels, and order blocks to help traders identify key market levels and potential trading opportunities.
Key Features
1. Custom Session Ranges
Define and visualize any trading session with customizable start and end times
Automatically calculates session high, low, and midpoint
Displays quarter levels (25% and 75% of range)
Shows range projections at 100%, 150%, 200%, and 250% extensions
2. Average Daily Range (ADR) Analysis
Calculates and displays ADR for daily, weekly, monthly, and custom timeframes
Shows projected high and low targets based on ADR
Includes "hash" levels at 50% ADR from session midpoint
Visual range boxes highlight potential support/resistance zones
3. Market Structure Levels
Daily and weekly opening prices with dynamic coloring
Previous daily and weekly center mass (50% of previous period's range)
Real-time range statistics displayed in an information table
4. Order Block Detection
Automatically identifies bullish and bearish order blocks
Visual representation with customizable colors and transparency
Mitigation tracking to remove invalidated blocks
Alert system for price interaction with order blocks
Parameter Guide
Display Settings
Show Blocks
Enables/disables order block visualization
Useful for cleaner charts when focusing on other elements
Show Previous Daily/Weekly Center Mass
Displays the midpoint of the previous period's range
Helps identify potential support/resistance from prior price acceptance areas
Show Daily/Weekly Open
Shows opening prices with color coding (blue for bullish, orange for bearish)
Important reference points for intraday trading
Show ADR Targets
Displays projected highs and lows based on Average Daily Range
Essential for setting realistic profit targets and stop losses
Show Range Projection
Extends the session range by multiples (1x, 1.5x, 2x, 2.5x)
Helps identify potential price targets during trending moves
Show Average Daily Range
Displays the ADR statistics table
Shows current range metrics for multiple timeframes
Display range in pips
Converts range values to pips for forex traders
Provides standardized measurement across different instruments
ADR Configuration
ADR Days
Number of days to include in current ADR calculation
Default: 1 (shows today's developing range)
ADR Period
Lookback period for calculating average range
Default: 14 days (standard period for volatility measurement)
Custom Range
Select between 60-minute or 240-minute timeframes
Allows analysis of intermediate timeframes
Session Time Settings (EST)
Start Hour/Minute
Define when your custom session begins
Default: 19:00 EST (Asian session open)
End Hour/Minute
Define when your custom session ends
Default: 02:45 EST (London session approach)
Extend To Hour/Minute
How far to extend the horizontal lines
Default: 19:00 EST (full 24-hour extension)
Visual Customization
Color Settings
Top Color: Used for upper levels and bullish projections
Bottom Color: Used for lower levels and bearish projections
Range Outline Color: Main session range boundaries
Center Range Line Color: Session midpoint visualization
Line Settings
Range Outline Width: Thickness of range box borders
Session Line Width: Thickness of horizontal level lines
Line Styles: Choose between solid, dashed, or dotted
Text Settings
Text Color: Color for all labels
Text Size: AUTO, tiny, small, normal, or large
Order Block Settings
Sensitivity
Percentage threshold for order block detection (1-100)
Higher values = fewer but stronger blocks
Default: 25 (detects 25% price movements)
OB Mitigation Type
Close: Block is mitigated when price closes beyond it
Wick: Block is mitigated when price wicks beyond it
Color Configuration
Separate colors for bullish and bearish blocks
Border and background colors can be customized independently
Trading Applications
1. Session-Based Trading
Identify the initial balance (first hour of trading)
Trade breakouts from defined session ranges
Use range projections for profit targets
Monitor for range-bound vs trending conditions
2. ADR-Based Strategies
Set daily profit targets based on ADR projections
Identify overextended moves when price exceeds ADR
Use ADR levels for position sizing and risk management
Compare current range to average for volatility assessment
3. Support/Resistance Trading
Use previous period center mass as dynamic S/R
Trade bounces from daily/weekly opens
Combine multiple timeframe levels for confluence
Monitor order blocks for potential reversal zones
4. Order Block Trading
Enter trades when price returns to unmitigated blocks
Use blocks as stop loss placement guides
Look for confluence with other indicator levels
Monitor block mitigation for trend confirmation
Best Practices
1. Multi-Timeframe Analysis
Use higher timeframe blocks for major levels
Combine with lower timeframe entries
Monitor weekly levels on daily charts
2. Confluence Trading
Look for areas where multiple levels align
Combine order blocks with ADR targets
Use session ranges with center mass levels
3. Risk Management
Use ADR for realistic daily profit targets
Place stops beyond order blocks or range extremes
Size positions based on distance to key levels
4. Alert Usage
Set alerts for ADR target hits
Monitor order block interactions
Track range breakouts and hash level tests
Tips for Effective Use
Start Simple: Begin with basic session ranges and ADR before adding all features
Color Coding: Use consistent colors across your trading setup
Time Zones: Ensure session times match your trading schedule
Clean Charts: Toggle off unused features for clarity
Backtesting: Study how price respects these levels historically
Journaling: Document which levels work best for your traded instruments
Common Trading Scenarios
Range Trading
Enter longs at session low or lower projections
Enter shorts at session high or upper projections
Target the session midpoint or opposite extreme
Breakout Trading
Wait for clear breaks of session range
Use range width for measuring targets
Monitor ADR to gauge breakout potential
Trend Following
Use order blocks as pullback entries
Trail stops using range projections
Scale out at ADR targets
Reversal Trading
Look for price rejection at ADR extremes
Monitor order block mitigation failures
Use center mass as reversal confirmation
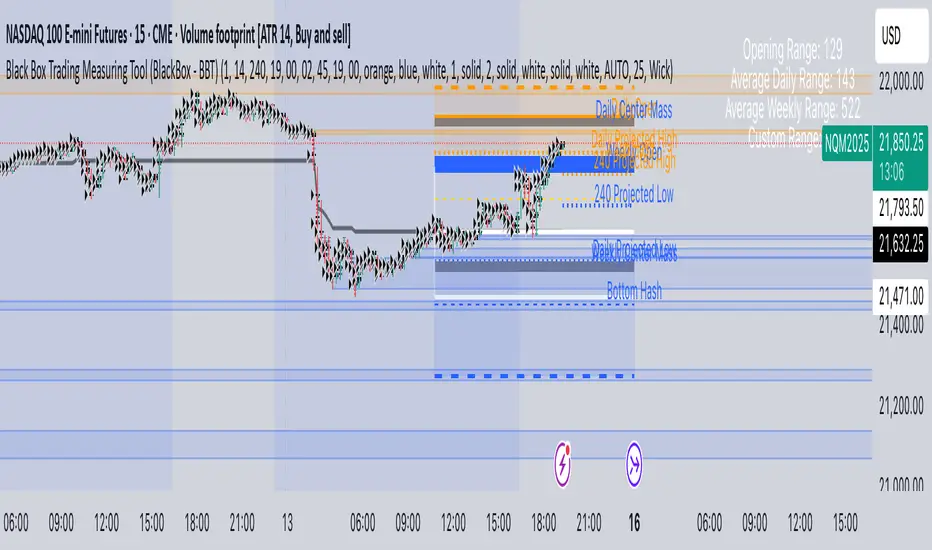
Session Breakouts & Trend Indicator# Session Breakouts & Trend Indicator
This indicator identifies high-probability trading opportunities by tracking key intraday sessions and their breakouts while aligning them with the overall market trend direction.
## What Makes This Indicator Unique
Unlike standard breakout indicators that only identify when price crosses a threshold, this indicator:
- Dynamically identifies and tracks important daily sessions (default: AM 09:00-10:00 and PM 15:00-16:00)
- Determines trend direction using a triple EMA system (20/50/200)
- Shows when breakouts align with the overall trend (higher probability setups)
- Provides visual confirmation with session ranges, breakout levels, and background highlighting
- Includes a comprehensive information panel showing trend/session alignment
## How It Works
The indicator tracks two important daily sessions:
1. **AM Session**: Typically the first hour of trading (default: 09:00-10:00)
2. **PM Session**: Typically the last hour of trading (default: 15:00-16:00)
For each session, it:
- Marks the high and low range
- Establishes breakout levels above/below these ranges
- Detects when price breaks beyond these levels
- Determines if the breakout aligns with the prevailing trend
The trend is calculated using three EMAs (20, 50, 200) for reliable trend identification.
## How To Use
1. Apply the indicator to your chart (works best on 5-minute timeframes)
2. Adjust session times to match your trading schedule if needed
3. Watch for breakouts above session highs (bullish) or below session lows (bearish)
4. Check the information panel to see if the breakout aligns with the trend
5. Enter trades in the direction of trend-aligned breakouts for higher probability setups
6. Set stop losses below the opposite side of the session range
## Settings
- **Session Times**: Customize AM and PM session times
- **EMA Lengths**: Adjust trend determination sensitivity
- **Visualization Options**: Toggle display of sessions, breakouts, and VWAP
- **Alert Settings**: Configure alerts for breakouts and trend-aligned conditions
This indicator is valuable for day traders and swing traders looking for objective entry points with higher probability of success.
